THE MOST IMPORTANT ASTERISK EVER (p 50 in Moving to Higher Ground by John Englander, April 6, 2021)
The most widely cited reference regarding climate change is the United Nation’s Intergovernmental Panel on Climate Change (IPCC). Its 5th Assessment Report (“AR5”), released in 2013,[1] looks at possible future climate according to four scenarios, identified as RCP 2.6, 4.5, 6.0, and 8.5. It is excellent in most everything except its widely-cited sea level projections.
Figure 9 shows the IPCC’s most common SLR projections, from lowest to highest, 28–98 cm (11–39 inches) in a very simple graphic showing the wide range of projections. Often overlooked, even in the worst-case projection, the total contribution from Antarctica is only 3 cm, just over an inch. Recall from Chapter 2 that Antarctica is far and away the largest source of potential SLR. If all of its ice melts, it would raise sea levels by 185 feet (56 meters) worldwide.
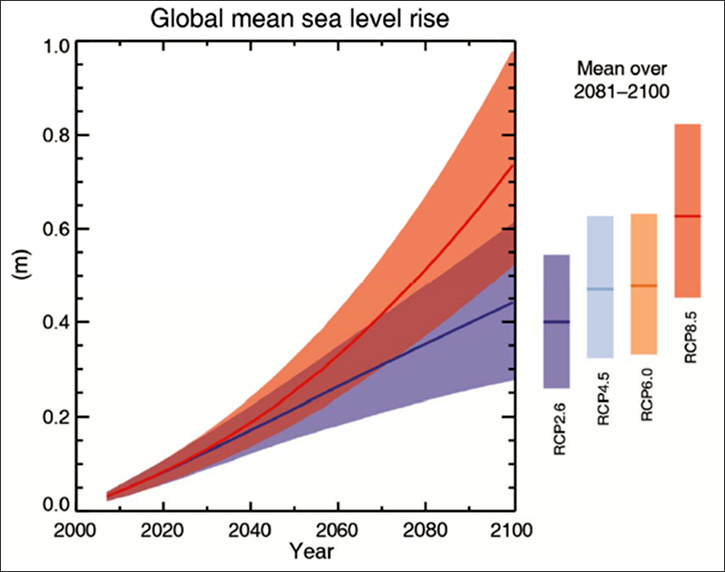
Figure 9: Projected sea level rise scenarios from the IPCC’s 5th Assessment Report (UN-IPCC, AR5, pg. 26, Figure SPM.9).
Figure 10 on the next page is also from the IPCC Report and gives more detail. However, the format can be confusing to interpret, so I have taken the source data, from Table 13-5 (page 1182), and reformatted it as a more traditional stacked-bar graph just below, Figure 11. This shows the four different IPCC scenarios, with increased warming from left to right. The light-blue bars represent the contribution from the Antarctic ice sheet. The amount of ice contribution from Antarctica does not change over the first three projections (2 inches or 5 cm). But in the fourth and warmest scenario, it is reduced to 1 inch (3 cm). That decrease in a warming world would seem counterintuitive, but is based on a well-established scientific principle.
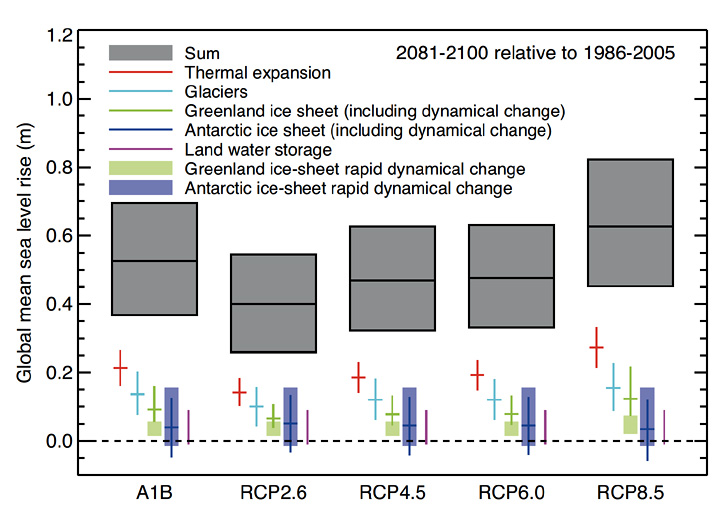
Figure 10: Projections from models with likely ranges and median values for global mean sea level rise and its contributions in 2081–2100 relative to 1986–2005 for the four SLR scenarios (UN-IPCC, AR5, pg. 1180, Figure 13).
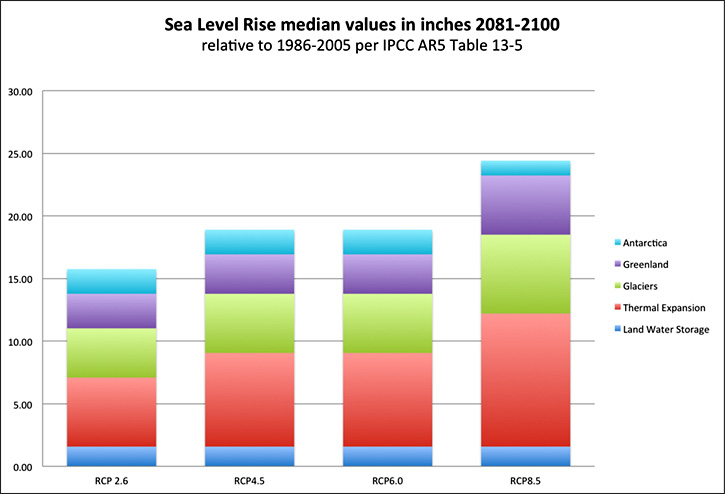
Figure 11: Median values and likely ranges for projections of global mean SLR and its contributions in meters in 2081–2100 relative to 1986–2005 for the four SLR scenarios (adapted from UN-IPCC, AR5, pg. 1182, Table 13-5).
Warmer water evaporates more quickly, so as the oceans warm, there will be more evaporation which will result in more precipitation, rain or snow. In cold areas, like East Antarctica, it’s snow. Thus, in a warming world these models show East Antarctica could have more snow/ice, technically reducing sea level.
However, recall from Deeper Dive Note #2 that East Antarctica is now beginning to show signs of destabilizing, which could result in more rapid melting and a net loss of the massive ice sheets and glaciers making even the most extreme scenario of the IPCC projection too low.
An even larger problem with the IPCC projections is the contribution from West Antarctica. Since there is no way to quantify how much ice will likely melt by 2100, that component is simply left out of the IPCC tabulations.
Do glaciologists believe that Antarctica will only contribute 1 inch (3 cm) to global SLR by 2100? Not at all. Paradoxically, the gross underestimation of SLR from Antarctic melting this century actually results from a rigorous scientific process. Many scientists and climate change researchers have missed this, so it’s worth explaining.
The First IPCC report, published in 1990, utilized an extremely rigorous scientific protocol, including multiple-level review by panels of experts, full disclosure of sources and calculations. Comment/question periods were open to any scientist in the world, as well as members of the public. All key concepts and data had to be published in peer-reviewed scientific journals. The projections had to be based specifically on the year 2100, and the data had to meet high standards of statistical significance.
Due to the uncertainty about the ice sheet and mega glaciers, Antarctica’s contribution was hardly included at all. If you look at the report carefully, in the fine print - essentially the footnotes - you’ll see the IPCC recognizes many diverging opinions from competent glaciologists concerned that the SLR contribution from Antarctica by the year 2100 could be as much as a meter or two (3 to 7 feet). But the data were too ambiguous to be included in the report with a projected value that met the IPCC’s rigorous standards. That’s why I refer to the omission of Antarctic contribution to SLR, as “the Antarctic Asterisk.” The only component that met their criteria allowed for an estimated 1 inch (3 cm) of SLR from Antarctica, which is clearly a gross underestimation of Antarctic contribution to SLR. This situation with the IPCC reflects a larger culture of scientific caution.
When it comes to rising sea level, it does not help us plan for the worst-case scenario, or even the mid-range scenarios. In other words, inadvertently, the good scientific process has caused a major understatement of the risk. Increasingly groups of planners and scientists have come to the realization that the IPCC projections for SLR are far too low. Many of us are hopeful that the next IPCC report, the Sixth Assessment, due out in 2022, will rectify the misleading way that the IPCC frames potential sea level. I should note that as formal input to the IPCC, that in December 2020, I was a contributing author on a paper making the case that IPCC sea level projections are understated, “Twenty-First century sea-level rise could exceed IPCC projections for strong-warming futures.”[2]
[1] T.F. Stocker et al., eds., “Climate Change 2013: The Physical Science Basis. Contribution of Working Group I to the Fifth Assessment Report of the Intergovernmental Panel on Climate Change”, IPCC (Cambridge, United Kingdom and New York, NY, USA: Cambridge University Press, 2013), doi:10.1017/CBO9781107415324.
[2] M. Siegert et al., One Earth, “Twenty-First century sea-level rise could exceed IPCC projections for strong-warming futures”, December 18, 2020, https://doi.org/10.1016/j.oneear.2020.11.002