REAL WORLD SLR PLANNING CHALLENGES, e.g. SOUTH FLORIDA (page 47 in Moving to Higher Ground, © John Englander, 2021)
Unstoppable sea level rise is certainly a huge problem. The wide range of sea level rise projections adds to the problem, particularly for a world that wants a simple “solution” and certainty. The real world rarely gives us certainty. Also, as covered in Chapter 4, professions like science, engineering, transportation planning, and emergency management, can each look at SLR projections very differently.
For example, the four counties of southeast Florida – Broward, Monroe, Miami-Dade, and Palm Beach – joined together in 2010 to form the Southeast Florida Regional Climate Change Compact. The goal of the collaboration was to develop a unified view on projected SLR to pool expertise and yield some consistency for the counties regardless of which side of the county line one was on. The Compact,[1] covers the area from Key West to West Palm Beach and includes Miami and Fort Lauderdale.
Their graph below, Figure 6, is produced is based upon SLR projections from multiple studies, plotted for three different time horizons: the years 2040, 2070 and 2120. This is excellent for planning purposes, effectively two decades, a half century and a full century from present. The table above the graph compares the three rather different projections from two very credible sources: a) the United Nations Intergovernmental Panel on Climate Change, 5th Assessment Report, better known as the “IPCC”[2] and b) the U.S. National Oceanic and Atmospheric Administration (NOAA).[3]
This chart and embedded table give a good sense of the range of projections for the next 100 years. which vary considerably. On one end of the range is the IPCC Median projection of 40 inches (~ 1 meters) of SLR by 2120, and on the other end is the NOAA Extreme projection of 175 inches (~4.5 meters) by 2120. This is a huge difference of more than 11 feet (3.4 meters) between the two projections.
Even on the shorter-term scale of the next two decades, the range between the projections is significant; the NOAA High projection is more than double the IPCC Median projection, 21 inches (53 cm) and 10 inches (25 cm), respectively. Needless to say, the wide variation presents a big problem for something that will reshape the world and lead to trillions of dollars of redesign, re-engineering, and relocation.
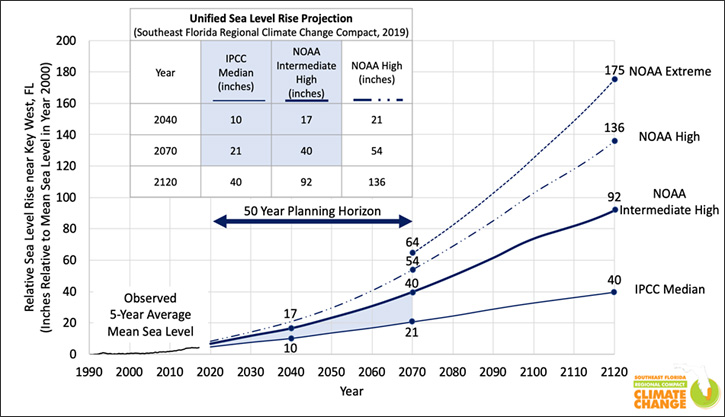
Figure 6: Current sea level rise projections used by the Southeast Florida Regional Climate Change Compact t[ guide development in the four counties, revised in 2019 (Southeast Florida Regional Climate Change Compact)
Another factor that makes projections difficult is the unpredictability of exactly how and when the ice sheets atop Greenland and Antarctica will melt, as discussed in Chapter 2. The models for the melting and collapse of the great glaciers and ice sheets are getting much better, thanks to the good field science on the ice sheets and better data from satellites and aircraft. But the cold, hard reality is that we cannot know in advance precisely how those massive ice sheets will melt, collapse, and slither into the sea.
It is also important to note that each agency that publishes SLR projections represents different communities and professions, each with its own culture and requirements. For example, the scientific community is represented by the IPCC; engineers are represented by the Army Corps of Engineers; and flood forecasters are represented by NOAA. When those three professions look to the future, their concerns, methods, and professional methodologies are quite different.
Scientists are focused on the physical processes and nuances of climate change. They often look at hundred-year timeframes as benchmarks. They are constrained by methodology and the requirements of high levels of statistical confidence. Scientists do not like to go out on a limb and publicly state opinions or even make highly educated inferences. Doing so would put them at risk of professional criticism. While this approach preserves the integrity of the scientific process, it creates problems for real-world decision making. This “Achilles Heel” of the scientific approach is exemplified by the IPCC’s 5th Assessment, as covered in Deeper Dive Note #6 – the most important asterisk ever, explaining why Antarctica is largely missing from the projections.
Engineers take a different approach to SLR projections than scientists. They often think in terms of 50 to 100-year project life spans and like to have a margin of safety in their designs. Engineers will consider the higher projections for SLR, even where there is uncertainty about the projections. Then they will often overdesign to have a margin of safety.
Flood forecasters and a wider field of focus now described as flood plain managers have yet another perspective. They want the latest, most comprehensive models to give flood warnings on a dynamic basis. While they will work with scientists and engineers closely, their mission is public safety.
It is clear that these three entities have very different perspectives and concerns about future flooding and that these concerns affect which of the forecasts they choose to follow. While it is important to look at all of the projections and recognize why they differ and the limitations of each, it’s easy to understand the different approaches taken depending on the focus of each.
When these differences of approach are not understood, it can lead to bad planning and policy. It’s best to plan for multiple SLR scenarios with a range of outcomes, including some that would be considered extreme.
[1] Southeast Florida Regional Climate Change Compact Sea Level Rise Work Group (Compact), Unified Sea Level Rise Projection for Southeast Florida, 5 (October 2015), A document prepared for the Southeast Florida Regional Climate Change Compact Steering Committee, http://southeastfloridaclimatecompact.org/wp-content/uploads/2015/10/2015-Compact-Unified-Sea-Level-Rise-Projection.pdf.
[2] T.F. Stocker et al., eds., “Climate Change 2013: The Physical Science Basis. Contribution of Working Group I to the Fifth Assessment Report of the Intergovernmental Panel on Climate Change”, IPCC (Cambridge, United Kingdom and New York, NY, USA: Cambridge University Press, 2013), doi:10.1017/CBO9781107415324.
[3] National Oceanic and Atmospheric Administration, GLOBAL AND REGIONAL SEA LEVEL RISE SCENARIOS FOR THE UNITED STATES, NOAA Technical Report NOS CO-OPS 083, Silver Spring, MD: January 2017, https://tidesandcurrents.noaa.gov/publications/techrpt83_Global_and_Regional_SLR_Scenarios_for_the_US_final.pdf.